
Admittance Relaxation Time Distribution (aRTD) for Quantification of Protein Concentration
Monitoring protein concentration in interstitial fluids is an interesting subject in the medical field because of its correlation to a patient's health. Albumin and γ-globulin are two of the most substantial proteins found in interstitial fluids. They are observable by electrical spectroscopy because of their interaction with electrical fields in dissolved form.
Quantification by electrical spectroscopy is a promising quantification method because of the low operating cost and fast measurement time. However, conventional electrical spectroscopy analysis, such as equivalent circuit analysis, is non-specific in nature and has multiple designs of equivalent circuits. The impedance relaxation time distribution (iRTD) analysis cannot detect the protein-specific dielectric phenomenon because of the large impact of charge transfer resistance in higher relaxation times measurements.
This study proposes admittance RTD (aRTD) to detect the effect of protein concentration on electrical spectroscopy in high (>0.01 s) and low relaxation times (≈ 1 µs). The formulation of aRTD is based on the admittance-based relaxation times distribution analysis of the modified Voigt-Maxwell equivalent circuit. The aRTD analysis provides a more specific analysis method and highlights the dielectric phenomenon in low relaxation times. A Ridge regression algorithm is used to connect the measurement admittance to the aRTD approximation.
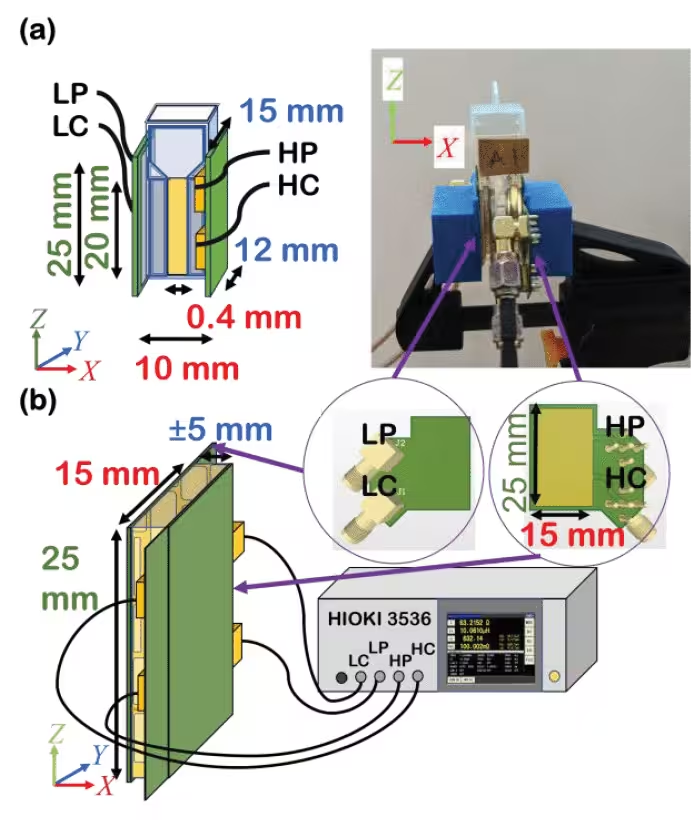
The proposed aRTD was evaluated on protein solution and injected porcine subcutaneous adipose tissue (SAT). The protein solution used in the measurements and injection are variations of albumin concentration between 0.80 – 2.30 g/dL, γ-globulin concentration between 0.40 – 1.15 g/dL, and 2:1 (albumin: γ-globulin) protein mixture concentration between 1.20 – 3.45 g/dL. A protein solution-filled cuvette and injected porcine SAT measurement were conducted with the object placed between a parallel electrode sensor under a 0.1 mA electric current with a frequency of 10 Hz until 1MHz.
This study assesses the peak detection result of aRTD transformation correlation to the albumin, γ-globulin, and total protein concentration. The high relaxation times (0.014 – 0.083s) aRTD peaks show a positive linear correlation to the protein concentration with an R2-value (coefficient of determination) above 0.8 for solution and injected porcine measurements.
The protein reorientation phenomenon is attributed to the positive linear relationship between the protein concentration and aRTD peak at high relaxation times. The low relaxation times (0.98 – 1.97 µs) aRTD peaks show a positive linear correlation to γ-globulin concentration, while albumin and total protein concentration show a negative linear correlation.
The correlation is attributed to the occurrence of protein β dispersion phenomenon at low relaxation times. The difference in correlation between albumin and γ-globulin to the low relaxation times aRTD peaks shows the ability of aRTD to differentiate the fluctuation of different protein concentrations. Comparison to the conventional iRTD transformation results shows a significantly lower average R2 value and lower fitting accuracy from the inverse solution compared to aRTD.
The aRTD analysis provides a novel approach to analyzing electrical spectroscopy measurement results. The high correlation and the differentiating capabilities of aRTD for protein fluctuation show promising results for analytical chemistry applications.